The Facebook Lead Forms Report analyzes the leads generated through forms, helping to evaluate the effectiveness of lead capture campaigns.
Steps to Access:
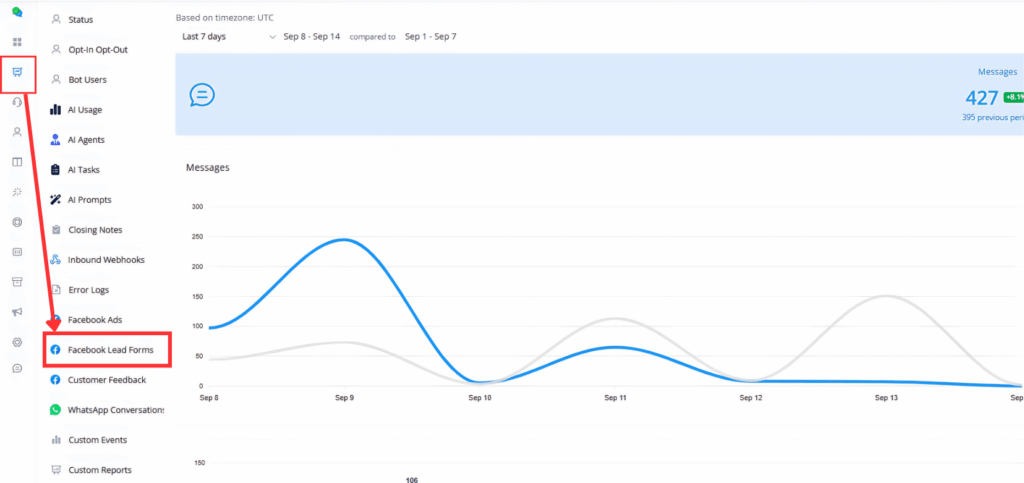
- Within your bot, go to Analytics.
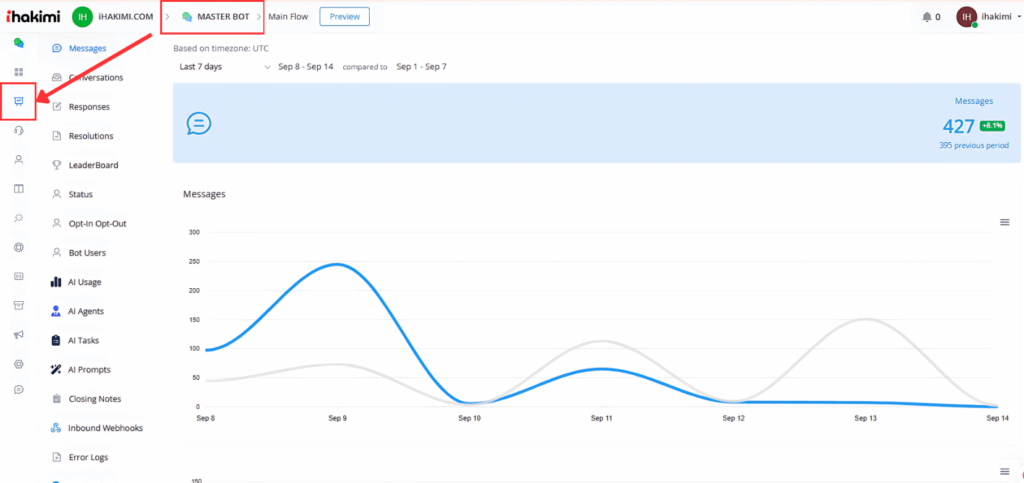
- Select Facebook Lead Forms from the left-side menu.
Available Report Types
Here is a brief explanation for the graphs in the Facebook Lead Forms reports:
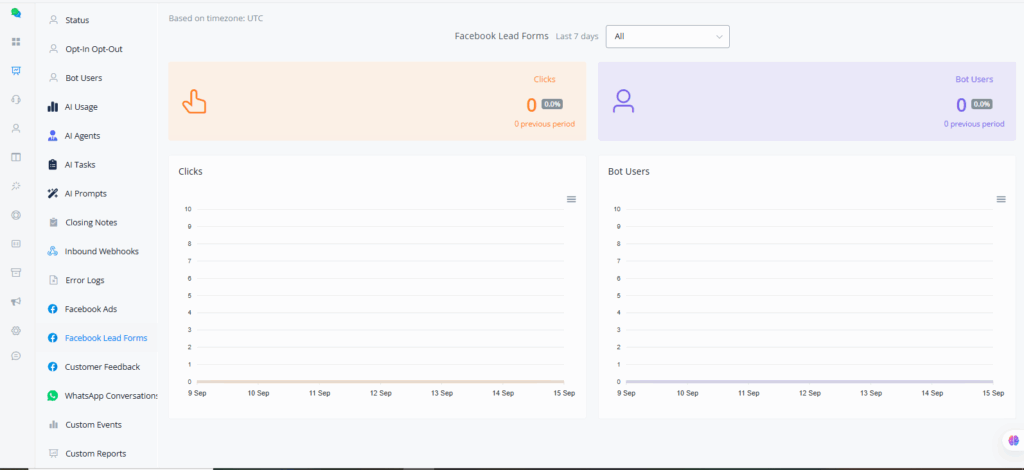
Line Graphs
- Clicks:
- The orange line represents clicks in the current period.
- The gray line represents clicks in the previous period.
- Bot Users:
- The blue line represents bot users in the current period.
- The gray line represents bot users in the previous period.
Filtering
- In the Facebook Lead Forms reports, you can filter the data displayed in the graph by all ads or by a specific ad reference payload, allowing for a more detailed performance analysis.
These descriptions provide a clear understanding of how to interpret the graphs and use the available filters to analyze the relevant data in each report.
If you need further assistance, please submit a ticket at [email protected]


